

April 7, 2024 - last updated
Real-world Applications and Use Cases
How To: Monitoring NLP models in production
Today, Natural Language Processing (NLP) models are one of the most popular usages of machine learning, with a wide variety of use cases. In fact, it’s projected that by 2025, revenue from NLP models will reach up to $43 billion along with AI in general.
What is Natural Language Processing & How is it Used?
Natural Language Processing (NLP) is a branch of artificial intelligence (AI) which aims to help computers understand, interpret and manipulate human language. NLP is often used to bridge the communication gap between humans and computers through a variety of disciplines, including computer science and computational linguistics. Sentiment analysis, translation, document classification & analysis, text summarization, and dialogue & conversations are among the most popular uses of NLP, and there are many more.
Why Should You Monitor Your NLP Models?
A natural language processing model can be an extremely effective tool for extracting information from unstructured text data. Though, when in production, a number of issues can arise, including: data drift, missing value rates, unexpected new values, etc. To make sure your model is working as intended, it’s important to monitor your NLP models in production, detect issues early, and intervene when necessary.
When you monitor your NLP models in the same manner as your tabular models, you can quickly miss a number of troublesome issues that could negatively affect your business in the long run.
The challenge is that organizations do not always adopt a monitoring solution in house that accommodates their specific models and use cases as this often takes additional technical resources. Using a monitoring solution like Aporia solves this issue and enables data science and machine learning teams to easily monitor their specific use cases and models.
Using Aporia, it is easy to integrate and start monitoring your NLP models for potential issues in the production environment.
How To Start Monitoring Your NLP Model With Aporia
First, start by integrating your NLP model with Aporia
For this example, we will use a sentiment analysis model to determine if a tweet has a positive or negative sentiment.
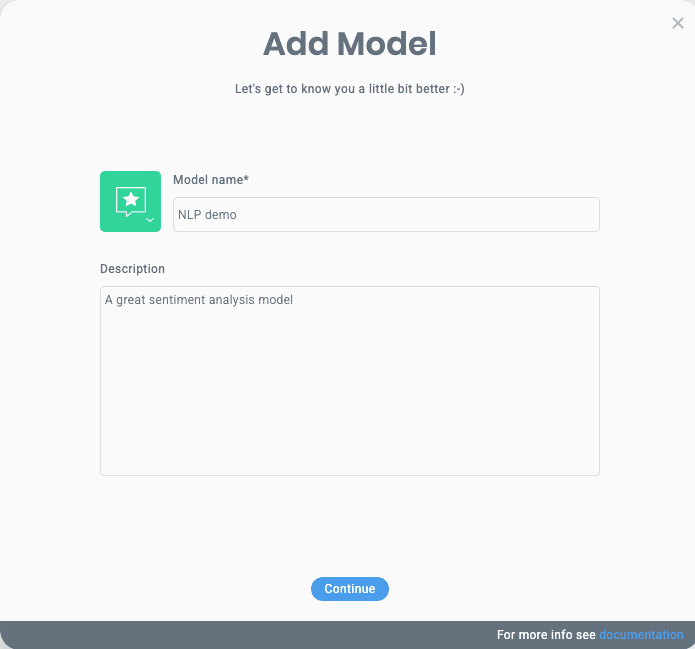
In the Aporia dashboard, click on the “+ Add model” button, and enter Model name, Description, and select icon and color for the model and follow the instructions.
When specifying the model’s schema, there are two types that can be used for NLP models:
- “text”
The text type can be used to describe raw input text (For example:a user’s input text or a tweet) - “vector”
The post-processed text that is predicted by the model can be reported as a vector)
pr_model_version = "v1"
apr_model_type = "binary"


apr_raw_inputs_schema = {
    "user_text": "text"
}

apr_features_schema = {
    "proccessed_data": "vector",
}

apr_predictions_schema = {
    "positive_sentiment": "boolean",
    "confidence": "numeric",
}
apr_model = aporia.create_model_version(
    model_id="tweets-sentiment-analysis",
    model_version=apr_model_version,
    model_type=apr_model_type,
    features=apr_features_schema,
    raw_inputs=Apr_raw_inputs_schema
    predictions=apr_predictions_schema
)
Monitor Your Data
Using Aporia, you can easily explore and monitor your models after reporting your data.
1. Select your newly created model from the Models page.
2. You can use the Data Segments tab to track a specific data segment based on text input.
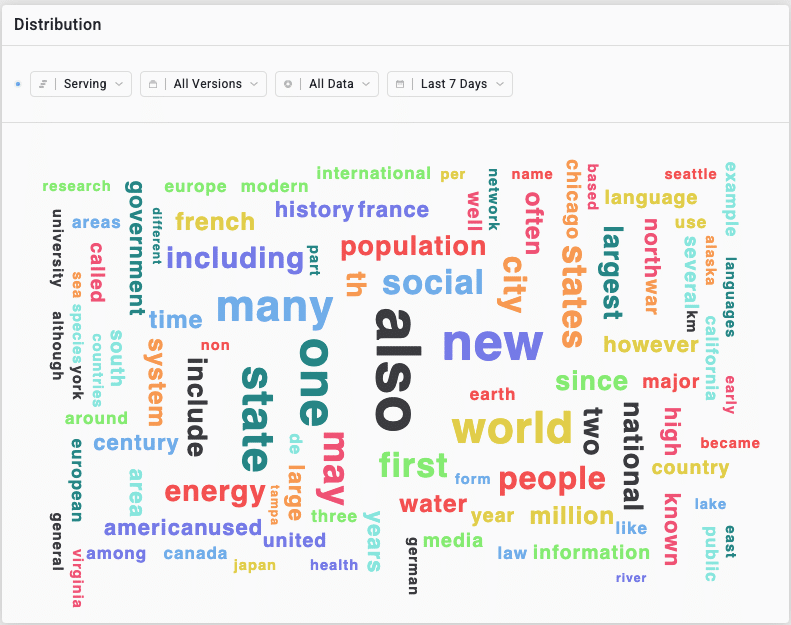
a. Select the custom segment and the raw input text type, then enter a list of words to monitor as the segments or select an auto segment based on the text length.You can use the Data Statistics tab to track the models data
b. A word cloud showing the most common words will appear when you click on the raw input text type.
c. Data can be filtered by created segments, model versions, environments, and prediction dates.
With Aporia, you can monitor your NLP model for data and prediction drift based on Kolmogorov–Smirnov distance, activity, missing values, staleness etc.
How To Start Monitoring Your NLP Model
1. Click on the Monitors tab to create a new monitor.
2. Once the monitor is saved, a new alert will be raised if a drift is detected.
Learn more in docs or try it out yourself with Aporia’s ML Experts – Book a demo and start monitoring your NLP models in minutes.
