

April 7, 2024 - last updated
Machine Learning
Feature Importance: 7 Methods and a Quick Tutorial
What Is Feature Importance?
In machine learning, feature importance scores are used to determine the relative importance of each feature in a dataset when building a predictive model. These scores are calculated using a variety of techniques, such as decision trees, random forests, linear models, and neural networks.
Feature importance can provide a way to rank the features based on their contribution to the final prediction. It can be used for feature selection, which is the process of selecting a subset of relevant features for use in building a model, although this might require domain expertise.
The scores can be calculated differently depending on the algorithm. Some common feature importance scores include: feature_importances_ in Random Forest, coef_ in linear regression, and feature_importances_ in xgboost.
This is part of an extensive series of guides about machine learning.
Why Is Feature Importance Useful in Machine Learning?
Feature importance is useful for machine learning tasks because it allows practitioners to understand which features in a dataset are contributing most to the final prediction, and which features are less important. This information can be used in a variety of ways:
- Feature selection: By identifying the most important features, practitioners can select a subset of relevant features for use in building a model, reducing dimensionality and noise in the data, and improving model interpretability.
- Model interpretability: By understanding which features are most important, practitioners can gain insights into the underlying relationships in the data and how the model is making predictions.
- Model debugging: If a model is not performing well, feature importance can be used to identify which features may be causing problems and require further investigation.
- Business decision-making: By understanding which features are most important, practitioners can make more informed decisions about which features to collect and how to allocate resources.
- Improving model performance: By removing less important features, practitioners can improve model performance by reducing overfitting and training time.
Model-Agnostic Feature Importance Methods
Model-agnostic feature importance (MAFI) is a type of feature importance that is not specific to any particular machine learning model or algorithm. Instead, it is a technique that can be applied to any model, regardless of its underlying architecture or complexity.
Correlation Criteria
Correlation criteria are a way to measure the association between two variables by calculating a correlation coefficient, such as Pearson’s correlation coefficient, which ranges between -1 and 1. A correlation coefficient of 1 means that the two variables are perfectly positively correlated, a coefficient of -1 means they are perfectly negatively correlated and 0 means they are not correlated.
Correlation criteria can be used as a model-agnostic feature importance method by calculating the correlation coefficient between each feature and the target variable, and selecting features with the highest correlation. A limitation of this approach is that correlation of features to certain outcomes does not guarantee that the feature is causally related to those outcomes.
Single-Variable Prediction
Single-variable prediction is a method of feature importance that measures the performance of a model when only one feature is used to make predictions.
This can be done by training a model using only one feature and comparing its performance to the performance of the model when all features are used. The feature that results in the highest performance when used alone is considered the most important.
It should be noted that the importance of a feature may depend on the context in which it is used – for example, a feature that is important in isolation may not be so important when considered in combination with other features.
Permutation
Permutation feature importance is a widely used model-agnostic feature importance method that measures the change in the model’s performance when the values of a particular feature are randomly shuffled. The idea behind this method is that if a feature is important, then shuffling its values should result in a decrease in the model’s performance.
Note that this method is sensitive to the specific shuffling, and to get more robust results there is sometimes a need for multiple rounds of shuffling.
The feature importance is calculated by measuring the change in model performance before and after shuffling. The feature that causes the largest decrease in performance is considered the most important.
Learn more in our detailed guide to permutation importance
Model-Dependent Feature Importance Methods
This type of feature importance is specific to a particular machine learning model or algorithm. It is calculated using techniques that are dependent on the specific model being used. These techniques are built into the model and are designed to provide information about the features that are most important for making predictions.
Linear Regression
Linear models, such as linear regression, provide coefficients as part of their output. These coefficients represent the relationship between each feature and the target variable and can be used to determine feature importance. The absolute value of the coefficients can be used to rank the features in order of importance, with the features having the largest absolute coefficient values considered to be the most important. However, coefficients do not always provide accurate or meaningful results. For example, there may be complex interactions between features that limit the usefulness of feature coefficients.
Logistic Regression
In logistic regression, feature importance is typically determined by the magnitude and sign of the coefficients of the independent variables. The magnitude of the coefficient represents the relationship between the independent and the dependent variable, and the sign of the coefficient represents the direction of the relationship (positive or negative).
Decision Trees
Decision trees and random forests are tree-based models that provide feature importances as part of their output. These importances are calculated based on how much each feature reduces the impurity in the tree.
Neural Networks
Unlike decision trees, neural networks are usually considered to be a black box, making it difficult to use an ANN to extract information for other purposes, such as explaining features. However, there are well known model-agnostic feature importance methods that can be used to understand the importance of features in neural networks – two examples are partial dependence plots and SHAP values. When properly configured, a neural network can identify feature correlations and help explain causality.
Python Feature Importance Using Scikit-learn
Calculating Importance
Here’s an example of how to calculate feature importance using the Scikit-learn library in Python:
- Import the classifier:
from sklearn.ensemble import RandomForestClassifier
from sklearn.datasets import make_classification
2. Generate a random dataset:
X, y = make_classification(n_samples=1000, n_features=10,
n_informative=5, n_classes=2, random_state=42)
3. Create a Random Forest Classifier and fit it to the data:
clf = RandomForestClassifier(n_estimators=100, random_state=42)
clf.fit(X, y)
4. Get and print the feature importance:
importances = clf.feature_importances_
for feature, importance in zip(X, importance):
    print(feature, importance)
In this example, we first generate a random dataset using the make_classification function from the sklearn.datasets module. Then, we create a RandomForestClassifier object and fit it to the data using the fit method. Finally, we use the feature_importances_ attribute of the fitted classifier to get the feature importances. We can then iterate through the features and importances and print them out:
Plotting Feature Importance on a Chart
It’s also possible to plot the feature importances using the plot_importance method of the fitted classifier as follows:
- Import the classifier:
from sklearn.ensemble import RandomForestClassifier
from sklearn.datasets import make_classification
import matplotlib.pyplot as plt
2. Generate a random dataset:
X, y = make_classification(n_samples=1000, n_features=10, n_informative=5, n_classes=2, random_state=42)3. Create a Random Forest Classifier and fit it to the data:
clf = RandomForestClassifier(n_estimators=100, random_state=42)
clf.fit(X, y)
4. Plot the feature importance:
plt.bar(range(X.shape[1]), clf.feature_importances_)
plt.xlabel('Features')
plt.ylabel('Importance')
plt.show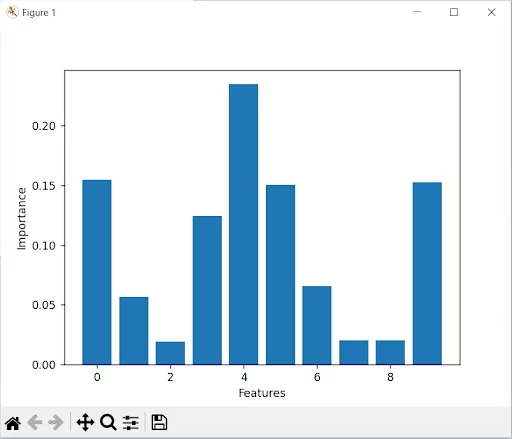
This will plot a bar chart of the feature importance, where the height of the bar represents the importance of the feature.
It’s important to note that these feature importance scores are calculated using the Gini impurity metric, which measures the decrease in the impurity of the tree caused by a feature. Other metrics can be used to calculate feature importance using other classifiers or libraries.
Feature Importance with Aporia
The Aporia AI Control platform is the ideal partner for AI leaders and engineers to visualize, monitor, explain, and improve AI models in production, while preventing risks in real time. Our platform fits naturally into your existing AI stack and seamlessly integrates with your existing ML infrastructure in minutes.
One common feature of Aporia is the calculation of feature importance, which ranks the significance of each input feature in predicting the output. This information can help practitioners to optimize their models by focusing on the most important features and potentially removing irrelevant or noisy ones. By leveraging tools like Aporia and feature importance, practitioners can ensure they’re getting the most out of their models in production.
We empower organizations with key features and tools to ensure high model performance:
Model Visibility
- Single pane of glass visibility into all production models. Custom dashboards that can be understood and accessed by all relevant stakeholders.
- Track model performance and health in one place.
- A centralized hub for all your models in production.
- Custom metrics and widgets to ensure you’re getting the insights that matter to you.
ML Monitoring
- Start monitoring in minutes.
- Instant alerts and advanced workflows trigger.
- Custom monitors to detect data drift, model degradation, performance, etc.
- Track relevant custom metrics to ensure your model is drift-free and performance is driving value.
- Choose from our automated monitors or get hands-on with our code-based monitor options.
LLM Hallucination Mitigation
- Mitigate LLM hallucinations in real time.
- Block off-topic content and keep your GenAI app on point.
- Prevent prompt injections and prompt leakage.
- Total SQL security.
- Block data leakage from your GenAI apps.
- Keep compliant with evolving regulations.
Explainable AI
- Get human readable insight into your model predictions.
- Simulate ‘What if?’ situations. Play with different features and find how they impact predictions.
- Gain valuable insights to optimize model performance.
- Communicate predictions to relevant stakeholders and customers.
Root Cause Investigation
- Slice and dice model performance, data segments, data stats, or distribution.
- Identify and debug issues.
- Explore and understand connections in your data.
To get a hands-on feel for Aporia’s advanced model monitoring and deep visualization tools, we recommend:
Book a demo to get a guided tour of Aporia’s capabilities, see ML observability in action, and understand how we can help you achieve your ML goals.
See Additional Guides on Key Machine Learning Topics
Together with our content partners, we have authored in-depth guides on several other topics that can also be useful as you explore the world of machine learning.
Auto Image Crop
Authored by Cloudinary
- Auto Image Crop: Use Cases, Features, and Best Practices
- 5 Ways to Crop Images in HTML/CSS
- Cropping Images in Python With Pillow and OpenCV
Advanced Threat Protection
Authored by Cynet
- What is Network Analytics? From Detection to Active Prevention
- Advanced Threat Protection: A Real-Time Threat Killer Machine
- Advanced Threat Detection: Catch & Eliminate Sneak Attacks
Multi GPU
Authored by Run.AI
- Multi GPU: An In-Depth Look
- Keras Multi GPU: A Practical Guide
- PyTorch Multi GPU: 3 Techniques Explained
