

April 8, 2024 - last updated
Real-world Applications and Use Cases
Customer Lifetime Value (LTV) Models: Applications, challenges, & conitoring
Online shoppers are growing exponentially. Now, a customer, on average, makes 19 online transactions per year. By 2025, e-commerce sales will reach a staggering $7.4 trillion, compared to $5.5 trillion in 2022. Due to its sheer scale, maintaining and assessing an e-commerce business’s performance requires efficient monitoring mechanisms.
Customer Lifetime Value (LTV) is one metric you can monitor to evaluate business performance accurately. A high customer LTV determines higher customer loyalty and long-term stable revenue.
In this blog, we’ll discuss customer LTV in detail. We’ll highlight its importance, business impact, and challenges associated with creating and maintaining LTV models in production. We’ll also suggest ways to monitor customer LTV to ensure that the metric stays relevant for decision-makers.
What is Customer Lifetime Value (LTV)?
Customer Lifetime Value (LTV) is equal to the total net value customers generate for a company over the period they stay with it. It includes finding out the average purchase value and the frequency of purchases to determine customers’ net value. A customer’s net value is the amount they would bring to the business minus the costs of the resources used to facilitate the customer, any debts you may write off, refunds, etc. Using customer LTV, businesses can compute future cash flows by considering all the future revenue streams and the relevant customer costs.
Moreover, businesses can add additional elements to compute more sophisticated customer LTV figures depending on the nature of the business and the type of customers. For example, you can break down your LTV metric by customers’ gender, location, age, ethnicity, etc., or by the time of the year to get more insights.
To determine if your customers are churning or what overall value they bring, you can calculate customer LTV. Customer Lifetime Value (LTV) is equal to the total net value customers generate for a company over the period they stay with it:
LTV = (A * F * (1 – Churn Rate)) / Discount Rate – Customer Acquisition Cost
A = average purchase value
F = frequency of purchases
Churn Rate = rate at which customers stop doing business with the company
Discount Rate = time value of money
Customer Acquisition Cost = cost associated with acquiring a new customer
Applications of Customer Lifetime Value (LTV) Models
Customer Lifetime Value (LTV) models play a crucial role in data-driven decision-making processes within businesses, allowing them to quantify the net present value of a customer’s relationship. By leveraging machine learning and statistical techniques such as linear regression, decision trees, or even deep learning, data scientists can construct more accurate and robust LTV models. These models enable businesses to segment their customer base, optimize marketing campaigns, and allocate resources efficiently, ultimately maximizing overall profitability.
For instance, a data scientist can train a machine learning model to predict LTV based on features such as demographics, purchase history, and customer behavior. The LTV predictions can then be utilized to prioritize high-value customers and design personalized marketing strategies to improve retention rates.
import pandas as pd
from sklearn.model_selection import train_test_split
from sklearn.linear_model import LinearRegression

# Load your dataset with relevant features and LTV
data = pd.read_csv('customer_data.csv')

# Preprocess and prepare the data (e.g., handling missing values, encoding categorical variables, etc.)

# Split the data into training and testing sets
X = data.drop('LTV', axis=1)
y = data['LTV']
X_train, X_test, y_train, y_test = train_test_split(X, y, test_size=0.3, random_state=42)

# Train a linear regression model
lr = LinearRegression()
lr.fit(X_train, y_train)

# Make predictions on the test set
y_pred = lr.predict(X_test)

# Evaluate the model using relevant metrics (e.g., R-squared, MAE, etc.)
The above code demonstrates a simplified example of using linear regression to predict LTV. In practice, more advanced models and feature engineering techniques can be employed to improve the model’s performance further. Additionally, cross-validation and hyperparameter tuning can be implemented to ensure the model generalizes well to unseen data.
Business Impact and Monitoring Customer Lifetime Value (LTV)
Businesses that aim to boost customer LTV and monitor their metrics carefully can generate high-value sales. For example, a customer group may initially purchase low-value items online as it involves less risk of losing out on a faulty product. But a business strategizing to increase LTV will likely offer personalized communications and recommendations to build trust and encourage customers to buy high-value items.
Ensuring a high LTV for specific customer segments garners brand loyalty, allowing you to spend less time and reduce marketing spending on new customer acquisition.
You can also drill down a specific customer group’s LTV to get an individual customer’s lifetime value (CLV). CLV will give you deeper insights into the value of each customer within a group.
Businesses often use machine learning (ML) techniques to build sustainable LTV models that can reliably predict an accurate value and provide the necessary insights. But gathering data for ML models, training, and deploying them in production is complex. Let’s discuss these challenges more in the next section.
Challenges of Customer LTV Models in Production
Computing customer LTV can be complex since it involves issues associated with predicting group behavior and the added challenges ML models offer. As predictive models use historical data to extrapolate future trends, obtaining accurate information on past behavioral patterns and transactions is significantly problematic. We can categorize this set of challenges as measurement-centric and ML-centric.
Measurement-centric challenges involve:
- Getting data on a customer group’s lifespan and retention rates
- Computing average purchases and transaction frequency per group
- Estimating future prices, costs, and refunds
- Building a versatile enterprise resource planning (ERP) or customer relationship management (CRM) system to track several variables.
On the other hand, ML-centric challenges include data quantity, quality, data drift, feature engineering, and deployment issues.
Let’s discuss these challenges in more detail.
Measurement-Centric Customer LTV Model Challenges
Lifespan: Businesses require customer retention rates to estimate their overall lifespan. For example, if your average customer retention rate is 80% per month within a group, your churn rate – the rate at which customers leave per month – is 20%. As such, that group’s average customer lifespan is around 5 months.
However, computing these rates precisely can be challenging because you are averaging the retention and churn rates over a customer group for a specific period. But, a group may have specific customers that may stay longer or leave earlier than the retention rate suggests.
Average purchases and transaction frequency: Computing a customer group’s average purchases and transaction frequency requires businesses to make logical assumptions about whether the group:
1. Will keep converting at the same rate in the future as it is now
2. Will buy the same items as now
Tracking such details is challenging and requires expert judgments regarding the group’s preferences, income levels, locations, etc.
Future prices, costs, and refunds: The purchase value depends on the price. And the price businesses charge will primarily depend on the costs incurred for producing, storing, and shipping an item in addition to overheads. And within e-commerce, refunds are expected, so you’ll have to estimate the expected refund value as well.
And if you’re planning to target a new customer segment, you’ll also have to consider customer acquisition cost (CAC) to compute customer LTV. But estimating CAC requires estimating all the marketing costs you would incur attracting the new group.
ERP/CRM systems: Businesses need a robust ERP/CRM system that seamlessly integrates with their e-commerce infrastructure to measure all the variables discussed above.
Challenges of ML-Driven Customer LTV Models
- Data quality & quantity: ML-based customer LTV models require sufficient data with suitable quality to give accurate predictions. But getting a clean dataset with relevant records for each customer within a segment is challenging.
Usually, datasets contain missing values, invalid entries, duplicate data, outliers, etc. Such issues require building robust Extract, Transform, and Load (ETL) pipelines to perform data ingestion, cleansing, transformation, and storage. But creating high-quality ETL pipelines is yet another challenge.
- Data drift: When data’s underlying statistical pattern changes and differs from the data on which the models are built, we call it data drift. For instance, customers’ buying patterns may differ in a specific year’s season. Failing to capture changing trends degrades the model’s accuracy and provides inaccurate predictions.
Models can also experience concept drift, where relationships between dependent and independent data variables change over time. For example, the average purchase value may no longer be a good predictor of a customer segment’s lifetime value due to fundamental changes in the behavior of specific customers within a group.
- Feature engineering: Feature engineering helps transform raw data into meaningful variables that businesses can use to build ML-based customer LTV models. For example, the average purchase value of a customer segment is a standard feature for predicting LTV. But it is challenging to compute features on grouped or aggregated data and ensure that they are historically accurate.
- Deployment: Deployment becomes particularly difficult when you have to scale your ML-based customer LTV models as they have to process more data.
As the customer base expands, businesses have to deal with large volumes of data, transform it, extract relevant features, and store it in accessible environments for further usage.
How to Monitor Customer LTV Models
Businesses can mitigate the challenges mentioned above through effective monitoring solutions that help identify issues in ML-based customer LTV models.
Monitoring allows businesses to track data drift, the model’s accuracy over time, ETL job failures, problems in the production environment, etc. For example, you can use evaluation metrics such as mean-squared error (MSE), root-mean-squared-error (RMSE), R-squared (R2), etc., to measure the LTV model’s accuracy in real-time.
Monitoring LTV models is essential to ensure their performance remains consistent over time. You can use performance metrics, such as Mean Absolute Error (MAE), Mean Squared Error (MSE), or R-squared, to evaluate and monitor the model’s predictive capabilities. Additionally, you can visualize the model’s performance by plotting actual LTV values against predicted LTV values. Here’s an example using Python, scikit-learn, and matplotlib:
import pandas as pd
import numpy as np
import matplotlib.pyplot as plt
from sklearn.model_selection import train_test_split
from sklearn.linear_model import LinearRegression
from sklearn.metrics import mean_absolute_error, mean_squared_error, r2_score

# Load your dataset with relevant features and LTV
data = pd.read_csv('customer_data.csv')

# Preprocess and prepare the data (e.g., handling missing values, encoding categorical variables, etc.)

# Split the data into training and testing sets
X = data.drop('LTV', axis=1)
y = data['LTV']
X_train, X_test, y_train, y_test = train_test_split(X, y, test_size=0.3, random_state=42)

# Train a linear regression model
lr = LinearRegression()
lr.fit(X_train, y_train)

# Make predictions on the test set
y_pred = lr.predict(X_test)

# Calculate performance metrics
mae = mean_absolute_error(y_test, y_pred)
mse = mean_squared_error(y_test, y_pred)
r2 = r2_score(y_test, y_pred)

print(f"Mean Absolute Error: {mae}")
print(f"Mean Squared Error: {mse}")
print(f"R-squared: {r2}")

# Visualize actual vs. predicted LTV
plt.scatter(y_test, y_pred)
plt.xlabel("Actual LTV")
plt.ylabel("Predicted LTV")
plt.title("Actual vs. Predicted LTV")

# Add a diagonal line to represent a perfect prediction
diagonal_line = np.linspace(min(y_test), max(y_test), 100)
plt.plot(diagonal_line, diagonal_line, 'r', linestyle='--')

plt.show()
In this example, we first calculate the performance metrics for the LTV model and print them out. Then, we create a scatter plot to visualize the relationship between actual and predicted LTV values. Ideally, the points should lie close to the diagonal red line, which represents perfect predictions.
To continuously monitor the LTV model, you can retrain and evaluate the model periodically (e.g., monthly, quarterly) using updated data. This way, you can track the model’s performance over time and make adjustments as necessary to maintain its accuracy and reliability.
Effective Monitoring for Customer Lifetime Value (LTV) Models Using Aporia
Customer LTV models are essential for business profitability. They help identify customer groups and allow marketing teams to create personalized marketing campaigns that appeal to specific segments. It enables you as a business to focus on more profitable segments and optimize business costs.
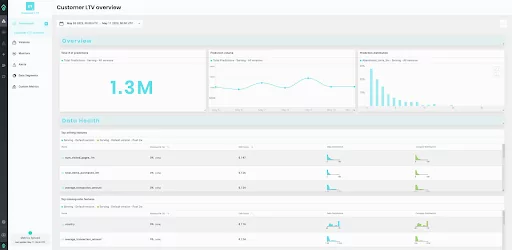
Visualizing LTV models provides a clear understanding of their performance and helps identify areas for improvement. Customized dashboards for each production model facilitate easy tracking of essential metrics and features, ensuring your LTV models perform optimally. Real-time performance visibility, coupled with the ability to analyze production data and insights, allows for effective communication with stakeholders. By customizing dashboards to display relevant metrics, graphs, and segments, you can better understand your LTV models’ behavior, make data-driven decisions, and optimize customer value strategies.
Monitoring models, especially LTV Models in production, is crucial for maintaining their accuracy and reliability. By using monitoring solutions, you can detect and address issues such as drift, bias, and performance degradation promptly.
Focusing on specific data segments allows you to track model behavior and identify biases, underperformance, or drifting features. Implementing a monitoring system with customizable alerts for problems like concept drift ensures that your LTV models remain effective and reliable, supporting data-driven decision-making processes within your business.
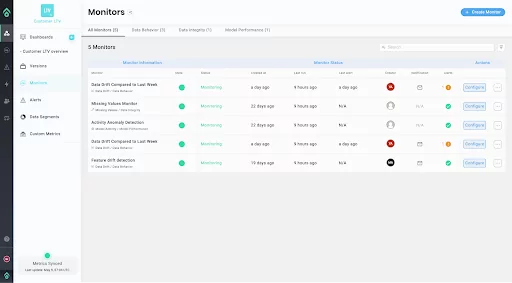
Aporia is the ML observability platform that provides dynamic dashboards, advanced model monitoring, customizable metrics, and code-based monitoring to help improve and scale production ML. With the platform, data science and ML teams can easily track model performance, activity, and behavior, and detect data drift and model staleness by tracking version updates.
Ready to boost your customer LTV performance?
Book a demo to see Aporia in action or for a more hands-on feel – start your free trial today!
