Aporia and Snowflake Pave the Way for Data Science Excellence
Today marks an extraordinary milestone in the journey of leveraging data science for transformative insights! We’re beyond thrilled to announce...
Aporia has been acquired by Coralogix, instantly bringing AI security and reliability to thousands of enterprises | Read the announcement
How do you ensure your model is working as it should in production? With Aporia you can track real-time model performance and create customized monitoring to detect any issue that may arise in production: data drift, performance degradation, unexpected bias, or data integrity issues. And we’re always looking for new ways to provide even more visibility, monitoring and investigation for your models in production.
We’re excited to announce that we’ve partnered with New Relic’s observability platform to provide full visibility for the entire ML pipeline fully integrated with your entire software stack, all in one, centralized platform.
Aporia’s new integration with New Relic’s Incident Intelligence Engine enables data scientists and ML engineers to receive a combination of custom and smart alerts integrated cross-platform, providing a broader picture of the ML infrastructure and an easier way to resolve issues more quickly.
It only takes a few minutes to set up and once integrated, you will have full access to a customized ML monitoring dashboard in New Relic. The dashboard contains six different charts: Most Active Models, Most Active Model Versions, Model Inferences, Average Numeric Inferences, Numeric Inferences Heatmaps, and Categorical Inferences for a comprehensive inferences investigation for all your models in production.
This integration also supports monitoring for almost all model use cases, including: fraud detection, NLP, Recommendations, Sales Forecast, Churn Prediction, Lead Prioritization, and Tabular Data.
By leveraging New Relic Alerts and Applied Intelligence, you will be able to monitor and manage alerts for all your operational needs. Find, troubleshoot, and resolve problems faster and automatically detect anomalies and combine related alerts and incidents to enable root cause analysis for any operational issues that may arise, even beyond the model itself.Adding Aporia to
Here’s a quick demo that shows exactly how to integrate Aporia with New Relic to connect all alerts and inference data from Aporia to New Relic’s Incident Intelligence engine, within the New Relic platform.
For additional information, you can also see our step-by-step technical guide for a full walkthrough of the process or Aporia’s documentation.
Once you combine the powers of Aporia and New Relic, you will have 100% visibility to your entire ML infrastructure. Congratulations!
With both Aporia and New Relic, you can sign up for free to start using their platforms. See Aporia in action and book a demo with our team to begin building customized monitoring for your models in minutes.

Today marks an extraordinary milestone in the journey of leveraging data science for transformative insights! We’re beyond thrilled to announce...
We are thrilled to announce the availability of our new EU region. Hosted in Germany, this region complies with the...
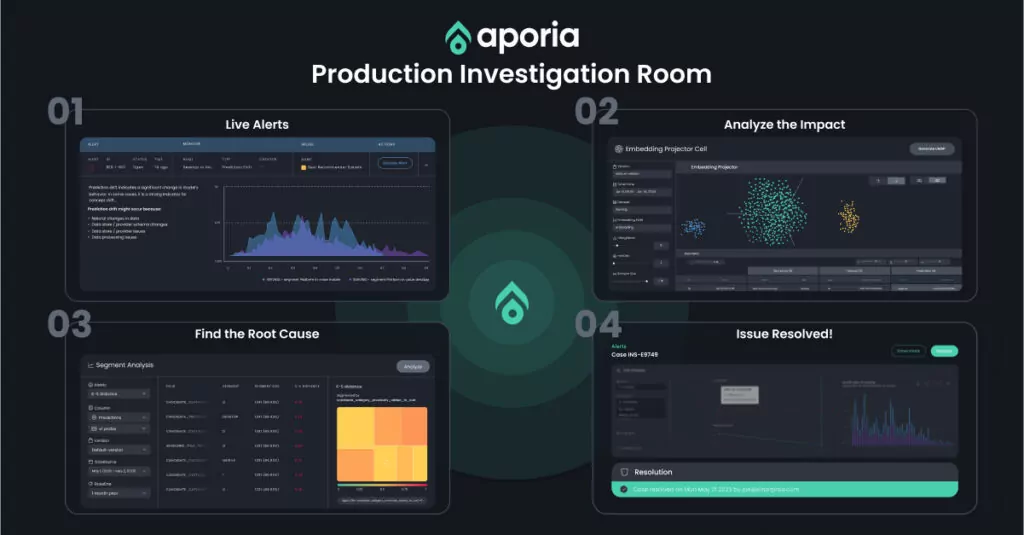
The first all-in-one tool for performing effective and swift root cause analysis in a collaborative, notebook-like experience.
We’re super excited to share that Aporia is now the first ML observability offering integration to the Databricks Lakehouse Platform....
We are excited to announce that Aporia is now available on the AWS Marketplace. Through this strategic partnership, it’s now...
Aporia’s Commitment to Data Privacy and Security We are proud to have achieved Health Insurance Portability and Accountability Act (HIPAA)...

We are excited to announce that we have just released a revision of our documentation. It took a quick second...

We are excited to announce that we have achieved SOC 2 Type II compliance. Achieving SOC 2 Type II compliance...