How to Convert a Dictionary to a DataFrame
Dictionary is a built-in data structure of Python, which consists of key-value pairs. In this short how-to article, we will...
Aporia has been acquired by Coralogix, instantly bringing AI security and reliability to thousands of enterprises | Read the announcement
This tutorial will show you how to build a robust end-to-end ML pipeline with Databricks and Aporia. Here’s what you’ll achieve:
Your journey begins with training your models and deploying them to production using Databricks and MLflow.
For this, we highly recommend browsing through the Databricks solution accelerators notebooks, which include examples for various use cases:
In each notebook, you’ll find step-by-step instructions on how to train these models using Databricks.
Once you’ve successfully trained your models, you can use MLflow to package them for deployment. MLflow helps package the model in a format that can be used for inference, regardless of how or where it was initially trained.
For batch models, you can create a scheduled job on Databricks to run the model on an hourly/daily/weekly/monthly basis.
For online models, you have two main options:
In production, your models will be making predictions on real-world data. The inputs and outputs of these models are known as inference data. It’s important to store this data for future reference, debugging, and model improvement.
By configuring your deployed models to log their inference data in Databricks Lakehouse, you not only have a safe storage solution but also a rich source of data for retraining your models and enhancing their performance over time.
For the next step in the ML pipeline, we’ll integrate the inference data into Aporia – the ML Observability platform, dedicated to monitoring ML models in production.
Aporia has a built-in integration with Databricks and does not send your data outside of the Lakehouse.
In three easy steps you can start monitoring billions of predictions and gain insights to improve model performance:
Managing multiple models separately can be daunting and often result in chaos and missed opportunities. Once integrated, Aporia simplifies this process by providing a unified hub for all your models, acting as a single source of truth for AI projects. This centralized view allows you to monitor billions of predictions at once and track key metrics across different models, providing a holistic view of your production ML pipeline.
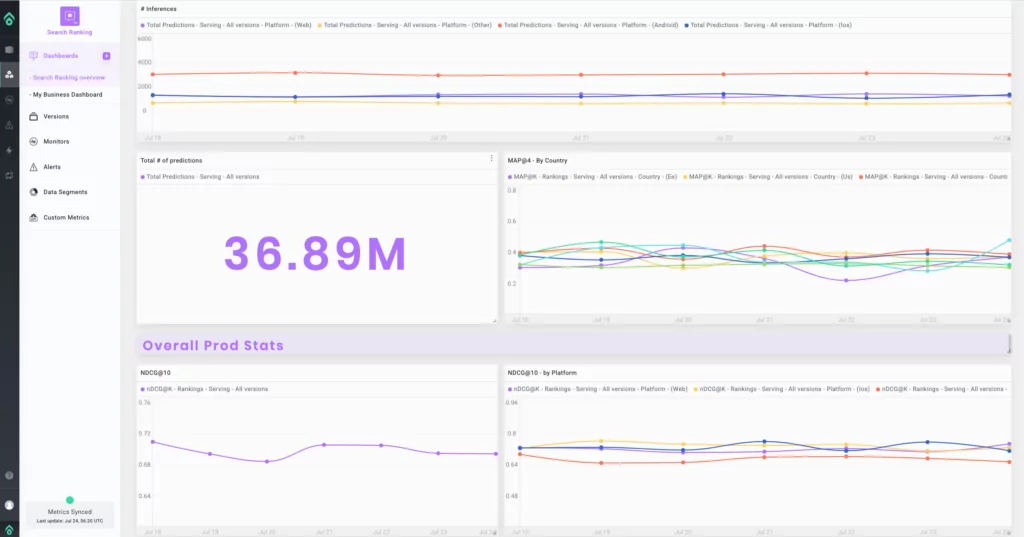
For each model, your AI leaders, engineers, and data scientists can customize dashboards to track performance, drift, and business metrics.

By directly connecting to your inference data from your Lakehouse, Aporia can constantly monitor the model’s performance and detect any significant changes in behavior or drift in your data.
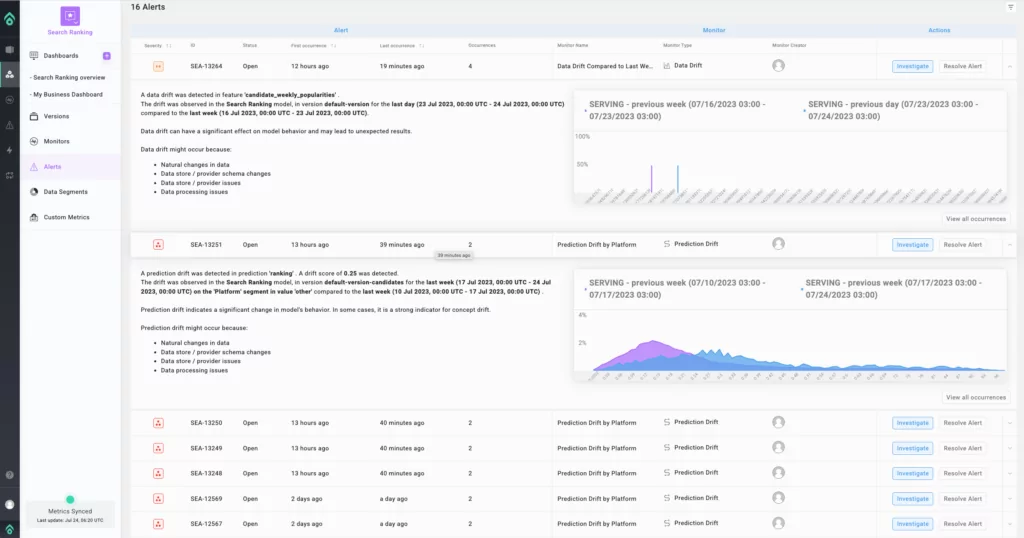
When drift is detected, Aporia raises an alert directly to your communication channel of choice, be it Slack, Microsoft Teams, Jira, PagerDuty, Webhook, or email.

You can then leverage the Aporia Production IR (Investigation Room) to investigate and explore your production data collaboratively with other team members, in a notebook-like experience.
Drift analysis reveals when the drift started, where it first originated, and the top drifted features that most impacted model predictions.
Segment analysis helps you identify problematic or excelling segments, taking the segment size and comparison metrics into account.
With the Databricks and Aporia ML pipeline, you can effortlessly train, deploy, monitor, and manage your models within the comfort of your Databricks environment. This synergy enables you to continuously improve your models, promptly address issues, and ultimately provide better value to your users.
ML observability is the heart of successful ML products. Aporia’s integration with Databricks Lakehouse empowers ML teams to effortlessly monitor all of their models, all in one place. This ensures that every model is held to the highest standard of performance and reliability, so organizations can truly rely on their ML initiatives to drive impactful business decisions.
Want to learn more about Aporia on Databricks? Drop us a line and see how easy ML observability can be.

Dictionary is a built-in data structure of Python, which consists of key-value pairs. In this short how-to article, we will...

A row in a DataFrame can be considered as an observation with several features that are represented by columns. We...

DataFrame is a two-dimensional data structure with labeled rows and columns. Row labels are also known as the index of...
DataFrames are great for data cleaning, analysis, and visualization. However, they cannot be used in storing or transferring data. Once...

In this short how-to article, we will learn how to sort the rows of a DataFrame by the value in...

In a column with categorical or distinct values, it is important to know the number of occurrences of each value....

NaN values are also called missing values and simply indicate the data we do not have. We do not like...

DataFrame is a two-dimensional data structure, which consists of labeled rows and columns. Each row can be considered as a...