How to Build an End-To-End ML Pipeline With Databricks & Aporia
This tutorial will show you how to build a robust end-to-end ML pipeline with Databricks and Aporia. Here’s what you’ll...
Aporia has been acquired by Coralogix, instantly bringing AI security and reliability to thousands of enterprises | Read the announcement
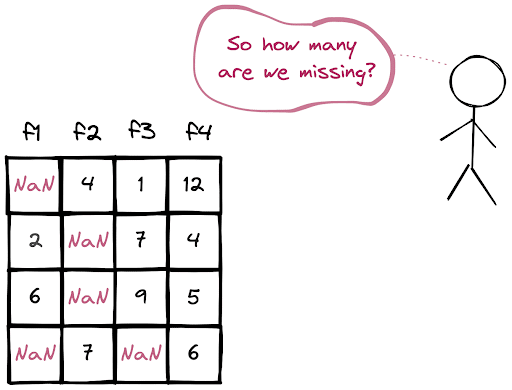
NaN values are also called missing values and simply indicate the data we do not have. We do not like to have missing values in a dataset but it’s inevitable to have them in some cases.
The first step in handling missing values is to check how many they are. We often want to count the NaN values in a specific column to better understand the data.
This short how-to article will teach us how to count the missing values in Pandas and PySpark DataFrames.

We can use the isna or isnull function to detect missing values. They returned a DataFrame filled with boolean values (True or False) indicating the missing values. In order to count the missing values in each column separately, we need to use the sum function together with isna or isnull.
df.isna().sum()

f1    2
f2    2
f3    1
f4    0
dtype: int64
If we apply the sum function, we will get the number of the missing values in the DataFrame.
df.isna().sum().sum()
5We can count the NaN values in each column separately in PySpark. The functions to use are select, count, when, and isnan.
df.select(
    F.count(F.when(F.isnan("number")==True, F.col("number"))).alias("NaN_count")
).show()

+---------+
|NaN_count|
+---------+
|        2|
+---------+
The isnan function checks the condition of being NaN, the count, and when the functions count the rows in which the condition is True.

This tutorial will show you how to build a robust end-to-end ML pipeline with Databricks and Aporia. Here’s what you’ll...

Dictionary is a built-in data structure of Python, which consists of key-value pairs. In this short how-to article, we will...

A row in a DataFrame can be considered as an observation with several features that are represented by columns. We...

DataFrame is a two-dimensional data structure with labeled rows and columns. Row labels are also known as the index of...
DataFrames are great for data cleaning, analysis, and visualization. However, they cannot be used in storing or transferring data. Once...

In this short how-to article, we will learn how to sort the rows of a DataFrame by the value in...

In a column with categorical or distinct values, it is important to know the number of occurrences of each value....

DataFrame is a two-dimensional data structure, which consists of labeled rows and columns. Each row can be considered as a...