How to Build an End-To-End ML Pipeline With Databricks & Aporia
This tutorial will show you how to build a robust end-to-end ML pipeline with Databricks and Aporia. Here’s what you’ll...
Aporia has been acquired by Coralogix, instantly bringing AI security and reliability to thousands of enterprises | Read the announcement
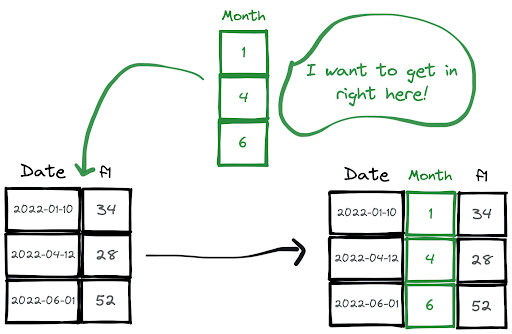
We often need to create a new column as part of a data analysis process or a feature engineering process in machine learning. In this short how-to article, we will learn how to add a new column to an existing Pandas and PySpark DataFrame.
months = [1, 2, 6]
df["Month"] = months
This method adds the new column at the end of the DataFrame as you see in the drawing above. If you want to add the new at a specific location, use the insert function.
months = [1, 4, 6]
df.insert(1, "Month", months)
The 3 parameters inside the insert function are the location, name, and the values of the new column. Therefore, the code block above adds a column named “Month” at index 1 which means the second column.

Instead of writing the month values manually, we can extract this information from the date column which is more practical when working with large datasets.
# Add at the end
df["Month"] = df["Date"].dt.month

# Insert as the second column
df.insert(1, "Month", df["Date"].dt.month)The new column can be added using the withColumn function. In PySpark, we cannot pass a list as the values of the new column. However, we can extract the month information from the date using the month and col methods.
from pyspark.sql import functions as F

df = df.withColumn("Month", F.month(F.col("Date")))
This tutorial will show you how to build a robust end-to-end ML pipeline with Databricks and Aporia. Here’s what you’ll...

Dictionary is a built-in data structure of Python, which consists of key-value pairs. In this short how-to article, we will...

A row in a DataFrame can be considered as an observation with several features that are represented by columns. We...

DataFrame is a two-dimensional data structure with labeled rows and columns. Row labels are also known as the index of...
DataFrames are great for data cleaning, analysis, and visualization. However, they cannot be used in storing or transferring data. Once...

In this short how-to article, we will learn how to sort the rows of a DataFrame by the value in...

In a column with categorical or distinct values, it is important to know the number of occurrences of each value....

NaN values are also called missing values and simply indicate the data we do not have. We do not like...