

February 29, 2024 - last updated
LLM Observability
Monitoring LLMs: Metrics, challenges, & hallucinations
This guide will guide you through the challenges and strategies of monitoring Large Language Models. We’ll discuss potential model pitfalls, provide key metrics for performance assessment, and offer a practical checklist to ensure model accountability and efficacy. Through this knowledge, readers can optimize their LLM performance and get the most value from these intricate models.
Setting the stage
You’ve been tasked with deploying a Large Language Model (LLM) for a new chatbot feature you’re rolling out and you want to make sure your LLM-powered chatbot is transparent and trustworthy. On top of that, you want to run sentiment analysis to derive cool new insights from your chatbot. Now that the scenario is set, let’s look at how you can monitor your LLM and generate insights for quick and seamless fine-tuning.

Challenges in Monitoring Large Language Models
LLMs can be quite a handful. They’re big, complex, and the moment you think you’ve got them figured out, they throw a curveball. You want them to write like Hemingway but sometimes they seem to channel a philosophy major writing their first essay. Here are some challenges you might face:
- Scale: The sheer size of LLMs means they generate heaps of data. Monitoring that tsunami of information is no easy task.
- Quality & accuracy: What’s a quality output? Shakespeare and modern-day texting are both English but hardly the same thing. Defining what’s “good” isn’t black and white. This goes the same for measuring your LLMs accuracy.
- Bias: These models can sometimes spew out biased or offensive content, and you want to catch that before it wreaks havoc.
From a bird’s eye view, these hurdles can stymie the unlocking of your LLM’s full prowess. Let’s delve into the underlying reasons for your language model’s shortcomings and explore how vigilant monitoring can be your catalyst in staying ahead of the game.
Improving LLM Accuracy: Reducing Hallucinations and Errors
LLMs, for all their brainy bits, have their blunders. Knowing when and where they’re goofing up is crucial. Let’s get into how you can keep tabs on hallucinations, bad responses, and funky prompts.
Monitoring hallucinations
Hallucinations in LLMs are when they start making things up. Not cool, right? Imagine your model pulling “facts” out of thin air! You need to keep a sharp eye on this. Set up an anomaly detection system that flags unusual patterns in the responses. You can also have a moderation layer that cross-checks facts with a reliable source. If your model claims that cats are plotting world domination, it’s probably time to rein it in.
Three reasons why LLMs hallucinate:
- Training Bias – Biases in training data and lack of diversity impede generalization, while their complex architecture challenges researchers in pinpointing and correcting these issues.
- Overfitting – Overfitting occurs when a LLM excessively adapts to its training data, resulting in a failure to generalize and potentially generating spurious, or “hallucinated,” content when faced with new, unseen data.
- Bad Prompts – When input prompts are murky, at odds, or self-contradictory, the stage is set for hallucinations to emerge. Although users don’t have a say in data quality and training, they hold the reins when it comes to input context. By sharpening their input game, users can nudge the results towards improvement.
Identifying bad responses
Now, you know that sometimes LLMs can whip up responses that nobody really wants. Monitoring user feedback can be a gold mine here. If users are reacting negatively or appear confused, take that as a sign.
Keeping prompts in check
Prompts are like the breadcrumbs you give LLMs to follow. Sometimes, they take those crumbs and go off into a maze. To monitor this, keep an eye on how well the model’s responses align with the intent of the prompts. Misalignments can lead to responses that are out of place. You can do this by having a human-in-the-loop to validate a subset of responses or set up a system that scores alignment and flags any that are drifting off into the weeds.
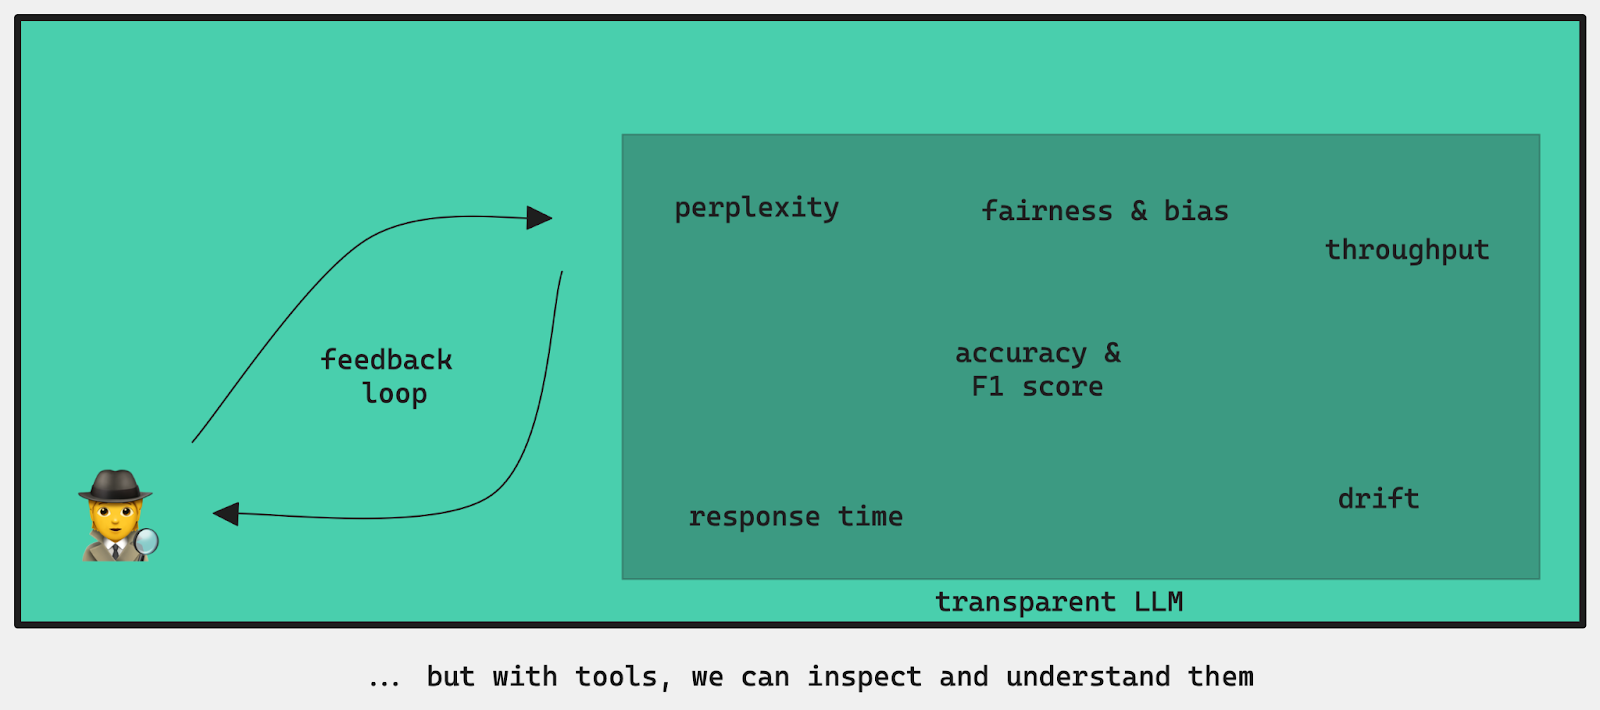
Key metrics to track for Large Language Models

Let’s talk about the key metrics that you should be tracking:
- Perplexity: This metric is akin to your LLM’s stress ball. It tells you how confused the model is with the tasks it’s trying to accomplish. Lower perplexity typically means the model is more confident in its outputs. (Not relevant to anyone using Open AI’s ChatGPT)
How to calculate Perplexity:
Perplexity = 2^(-Σ(p(x) * log2(p(x))))
- Token Efficiency: LLMs, particularly models like GPT, consume tokens for both input and output. Tokens can be as short as one character or as long as one word. Monitoring how efficiently an LLM uses tokens is essential for controlling costs and ensuring that the model doesn’t exceed its maximum token limit.
How to calculate Tokens efficiency: This is more of a practical metric, and there isn’t a standard formula for it. However, you can think of it in terms of tokens used relative to the total tokens available. For example, if a model has a maximum token limit of N, and it uses M tokens for a given input-output pair, the token efficiency could be represented as the ratio: Token Efficiency = M/N
- Response Time: Be considerate of your users’ time. You don’t want your LLM to be that slowpoke who takes ages to respond. If it does, users might ditch it faster than you can say “cold cup of coffee”.
How to calculate Response Time: This is usually measured in seconds or milliseconds and represents the time taken by the model to respond to a user’s request. It can be measured as the difference between the time when the response is received and the time when the request was sent.
Response Time = Time(Response Received) – Time(Request Sent)
- Accuracy and F1 Score: You need to know how often your model is hitting the bullseye or missing the mark. Accuracy gives you an idea of how often your model is right, while the F1 Score provides a balance between precision (how many of the predicted positives are actually positive) and recall (how many actual positives were predicted correctly). (only relevant for certain AI tasks, for example using LLMs for classification.)
How to calculate Accuracy:
Accuracy = (True Positives + True Negatives) / (True Positives + False Positives + True Negatives + False Negatives)
How to calculate F1 Score:
F1 Score = 2 * (Precision * Recall) / (Precision + Recall)
Where Precision = True Positives / (True Positives + False Positives) and Recall = True Positives / (True Positives + False Negatives)
- Throughput: When measuring the efficiency of your LLM, it is important to consider throughput – the number of requests or operations your model can handle per unit of time. This is particularly crucial in high-traffic environments where a high volume of requests needs to be processed swiftly.
How to calculate Throughput: This is typically measured in requests per second (RPS) or operations per second and represents the number of requests or operations the model can handle in a unit of time.
It can be calculated as: Throughput = Total Number of Requests / Total Time Taken
- Drift: Changes in the data distribution over time can lead to a decrease in model performance, a phenomenon known as “drift”. Be sure to keep an eye on your model’s inputs and outputs for any changes. This can be crucial in the early detection of shifts in user behavior or environmental changes that your model needs to adapt to.
How to calculate Drift: This is a complex metric to measure as it involves monitoring changes in the data distribution over time. There isn’t a single formula for drift, but it typically involves comparing the performance of the model on current data to its performance on historical data.
- Fairness Metrics: LLMs are known to sometimes carry and perpetuate biases found in the data they were trained on. Organizations should monitor and quantify biases in model outputs using fairness metrics. This can be domain-specific and include metrics like gender bias, racial bias, or other forms of unintended bias.
How to calculate Fairness: These metrics are often domain-specific and don’t have a one-size-fits-all formula. However, they generally involve comparing the performance or outcomes of the model across different demographic groups. For example, Gender Bias can be measured by comparing the model’s performance for male vs. female inputs.
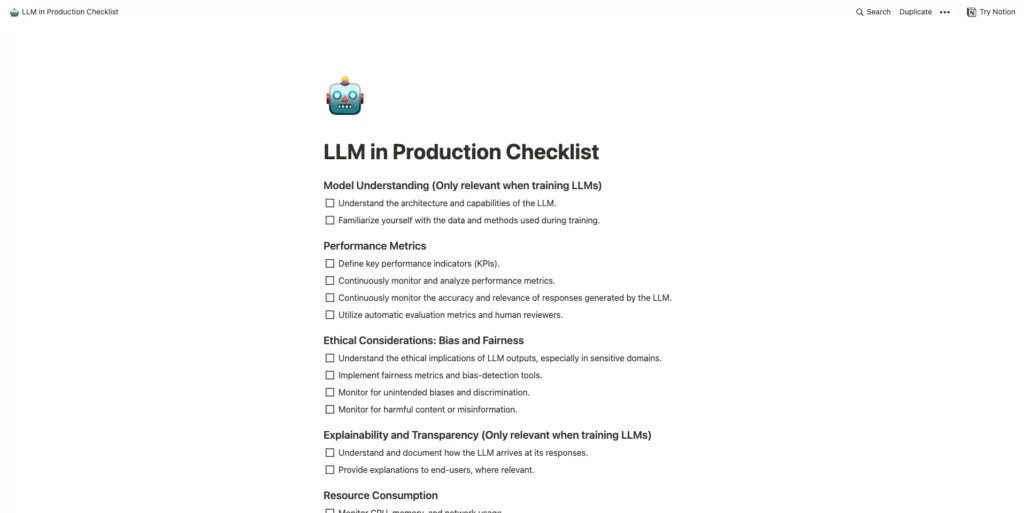
The checklist for LLMs in production
While developers and organizations rush to implement LLMs into their products or create new products based on the GPTs of the world, in order to use these models in an effective way requires all ML stakeholders to ensure the responsibility, accountability, and transparency of these models. Keep tabs on these fundamental tasks to ensure the accuracy and performance of your LLM-powered AI product.
Disclaimer: Some items on the checklist pertain only when developing and deploying proprietary LLMs.
The takeaway
Your LLM is like a talented but sometimes scatterbrained writer. By monitoring hallucinations, bad responses, and prompts, you can make sure your LLM stays on track and delivers the value you and your users are looking for. Make every word count.
Are you working with LLMs? Try out Aporia and see how LLM observability helps you keep track of your model performance, ensuring that every word counts, or chat with one of our LLM experts to learn more.
