Igal Leikin
Feature importance is a technique used in machine learning to determine the relative importance of each feature in a dataset when predicting a target variable. It helps to identify which features have the most significant impact on the model’s performance and can be used to reduce the dimensionality of the dataset by removing less important features.
Feature importance is typically measured using methods such as permutation importance, mean decrease impurity, or SHAP values. By understanding feature importance, data scientists can make more informed decisions about which features to include in their models and how to optimize them to improve overall performance.
Using Python for feature importance provides several benefits due to its extensive ecosystem of libraries and tools, ease of use, and versatility. Some of the key benefits of using Python for feature importance include:
Scikit-learn is a popular Python library used for machine learning and data analysis tasks. It provides a wide range of algorithms and tools for building predictive models, including methods for feature selection and ranking.
In scikit-learn, there are several ways to compute feature importance, including:
coeff_ property that contains the coefficients for each input variable. These coefficients provide a crude feature importance score.coeff_ property that contains the coefficients for each input variable. These coefficients provide a crude feature importance score.feature_importances_ property that can be accessed to retrieve the relative importance scores for each input feature.Here is an example of feature importance in Python that uses a forest of trees to calculate importance for artificial classification tasks. This example is based on the scikit-learn documentation.
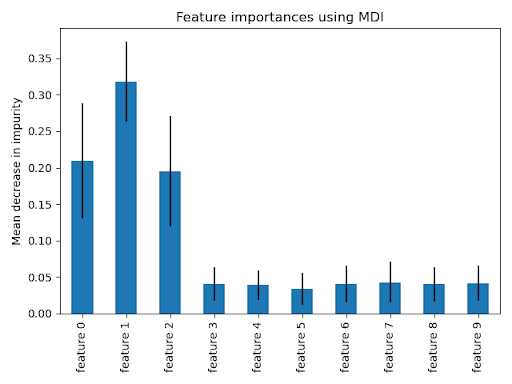
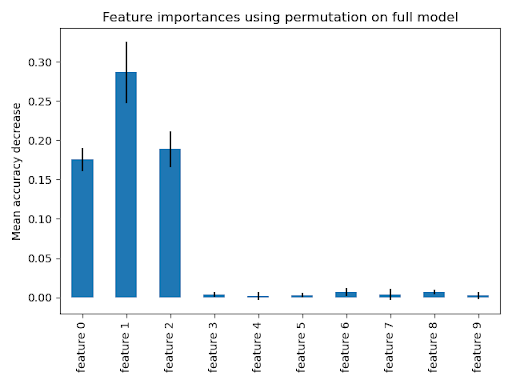
The blue bars in the diagrams below show the forest’s feature importance alongside the inter-tree variability, represented as error bars. The plots used in this example suggest that only three features are informative but the rest are not. We can generate a plot using the following:
<span style="font-weight: 400;">import matplotlib.pyplot as plt</span>In this example we create a synthetic dataset of the three informative features. We’ll avoid shuffling the dataset so that these features correspond to the first three columns. We’ll also split the dataset into subsets for training and testing:
from sklearn.datasets import make_classification
from sklearn.model_selection import train_test_split

X, y = make_classification(
    n_samples=1000,
    n_features=10,
    n_informative=3,
    n_redundant=0,
    n_repeated=0,
    n_classes=2,
    random_state=0,
    shuffle=False,
)
X_train, X_test, y_train, y_test = train_test_split(X, y, stratify=y, random_state=42)
The next step is fitting a Random Forest classifier to calculate the importance:
from sklearn.ensemble import RandomForestClassifier

feature_names = [f"feature {i}" for i in range(X.shape[1])]
forest = RandomForestClassifier(random_state=0)
forest.fit(X_train, y_train)Feature importances are provided by the feature_importances_ fitted attribute provides the feature importances, which are calculated as the standard deviation and mean of each tree’s decrease in impurity:
import time
import numpy as np

start_time = time.time()
importances = forest.feature_importances_
std = np.std([tree.feature_importances_ for tree in forest.estimators_], axis=0)
elapsed_time = time.time() - start_time

print(f"Elapsed time to calculate feature importances: {elapsed_time:.3f} seconds")
Next, we can plot the importance based on impurity:
import pandas as pd

forest_importances = pd.Series(importances, index=feature_names)

fig, ax = plt.subplots()
forest_importances.plot.bar(yerr=std, ax=ax)
ax.set_title("Feature importances with MDI")
ax.set_ylabel("Mean impurity decrease")
fig.tight_layout()
As expected, we can see that the first three features are shown to be important.
Permutation-based can help overcome the bias towards features with high cardinality but still relies on the relationship between features and the target variable. It is calculated on the training set, and can then be used to evaluate feature importance on the test set.
from sklearn.inspection import permutation_importance

start_time = time.time()
result = permutation_importance(
    forest, X_test, y_test, n_repeats=10, random_state=42, n_jobs=2
)
elapsed_time = time.time() - start_time
print(f"Elapsed time to calculate feature importances: {elapsed_time:.3f} seconds")

forest_importances = pd.Series(result.importances_mean, index=feature_names)
However, this approach is more expensive because it shuffles features n times, refitting the model to estimate its importance:
fig, ax = plt.subplots()
forest_importances.plot.bar(yerr=result.importances_std, ax=ax)
ax.set_title("Feature importances with permutation on the full model")
ax.set_ylabel("Decrease in mean accuracy")
fig.tight_layout()
plt.show()
Both methods will identify the same features as the most important, although their relative importance may vary. However, the above plots reveal that mean decrease in impurity (MDI) is less likely to omit features than a permutation-based approach.
Aporia leverages feature importance in explainability by measuring the impact of each feature on the model’s output to allow data scientists and ML engineers to identify and explain the most influential features driving predictions. Moreover, the platform’s feature importance analysis facilitates the evaluation of the model’s fairness and transparency, ensuring compliance with regulatory and ethical requirements. By incorporating feature importance in its suite of monitoring and explainability tools, Aporia empowers users to maintain control and understanding of their models, fostering trust and confidence in the deployment of machine learning solutions. Aporia empowers organizations with key features and tools to ensure high model performance:
To get a hands-on feel for Aporia’s advanced model monitoring and deep visualization tools, we recommend:
Book a demo to get a guided tour of Aporia’s offerings and understand how we can help you achieve your ML goals.