

April 4, 2024 - last updated
Machine Learning
A Comprehensive Guide to Mean Absolute Percentage Error (MAPE)
Today we’re going to delve into a vital metric called Mean Absolute Percentage Error, or MAPE for short. Understanding MAPE is crucial if you are dealing with forecasting models. So let’s get started!
What is MAPE?
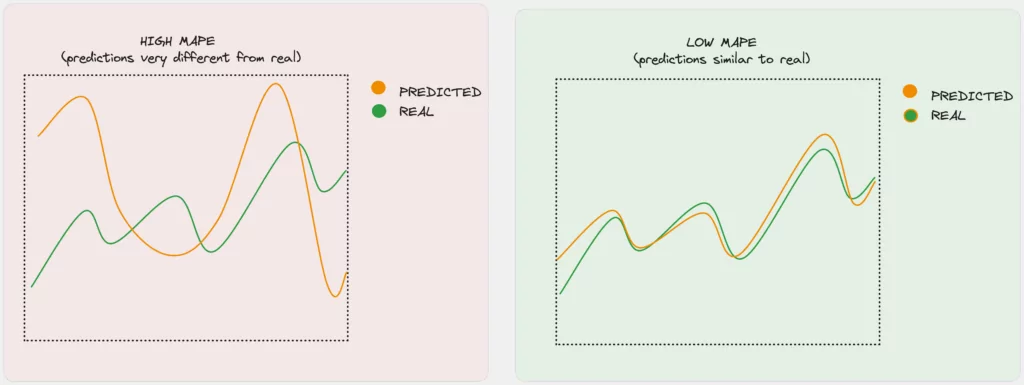
Before jumping into calculations, let’s understand what Mean Absolute Percentage Error (MAPE) really is. In simple terms, it is a statistical measure that helps you determine how accurate your predictions or forecasts are in relation to the actual values. In forecasting models, such as time series analysis, it’s crucial to gauge the performance of your model, and MAPE offers a handy means to do just that. It expresses the error as a percentage, making it easier for you to interpret and communicate the model’s accuracy.
How to calculate MAPE
Knowing the importance of MAPE, the next step is to learn how to calculate it. It’s surprisingly simple!
MAPE Formula
The formula for MAPE is:

Where:
- MAPE is the Mean Absolute Percentage Error
- ‘n’ is the number of data points
- Ai is the actual value for the ith data point
- Fi is the forecasted value for the ith data point
By iterating through each data point, calculating the absolute percentage error, and then averaging them, you obtain the MAPE. The result is a percentage indicating the average deviation of the predicted values from the actual values.
Measuring forecasting accuracy with Mean Absolute Percentage Error
Now that you understand how to calculate MAPE, let’s explore how you can use it to measure the accuracy of your forecasting models.
- Evaluate Model Performance: By comparing the MAPE of different models, you can evaluate which model performs better in terms of forecasting accuracy.
- Interpreting MAPE: Lower values of MAPE indicate higher accuracy, while higher values indicate lower accuracy. A MAPE of 5% implies that, on average, the predictions are 5% off from the actual values.
- Communicate Performance: Since MAPE is expressed as a percentage, it’s easy to communicate the performance of your model to stakeholders who might not be as technically inclined.
However, keep in mind that MAPE has its limitations. It cannot be used when the actual values have instances of zero, as this would lead to division by zero in the formula. Additionally, MAPE can sometimes favor models that under-forecast.
In order to illustrate how MAPE can favor models that under-forecast, especially when forecast values approach zero, consider two scenarios:
Scenario 1 (Over-forecast with small actual value):
- Actual value: 10
- Predicted value (over-forecast): 20
The MAPE in this case would be:
MAPE = (|10 - 20| / 10) * 100% = 100%
Scenario 2 (Under-forecast with small actual value):
- Actual value: 10
- Predicted value (under-forecast): 0
The MAPE in this case would be:
MAPE = (|10 - 0| / 10) * 100% = 100%
In these two scenarios, the over-forecast has the same percentage error as the under-forecast.
However, if the under-forecast is very close to zero but not exactly zero, the MAPE is still high.
Let’s consider an extra scenario to illustrate this:
Scenario 3 (Under-forecast close to zero):
- Actual value: 10
- Predicted value (under-forecast): 0.0001
The MAPE in this case would be:
MAPE = (|10 - 0.0001| / 10) * 100% = 99.999%
But if the under-forecast is exactly zero, the MAPE is zero:
Scenario 4 (Under-forecast exactly zero):
- Actual value: 10
- Predicted value (under-forecast): 0
The MAPE in this case would be:
MAPE = (|10 - 0| / 10) * 100% = 100%
Despite the actual value being 10, an under-forecast of exactly zero results in a MAPE of 100%. This is the reason why MAPE can sometimes favor models that under-forecast, especially when the forecast values are very close or equal to zero.
Limitations of Mean Absolute Percentage Error
As with any metric, MAPE comes with its own set of limitations. Being aware of these will help you make better-informed decisions regarding when to use MAPE.
- Inaccuracy with Low Actual Values: As the actual values approach zero, the percentage errors can become extremely large even if the forecasted values are close to the actual values. This can distort the MAPE.
- Cannot Handle Zero Actual Values: MAPE is undefined when actual values are zero, as this leads to division by zero in the formula.
- Scale Dependence: Being a percentage error, MAPE can sometimes be tricky to interpret when comparing across different scales or units.
- Not Ideal for Comparing Across Different Datasets: Due to its scale dependence, it is not the best metric for comparing the forecasting accuracy across datasets that have different scales or units.
In light of these limitations, it is advisable to use MAPE in conjunction with other evaluation metrics such as Mean Absolute Error (MAE) or Root Mean Squared Error (RMSE) to get a more comprehensive understanding of your model’s performance. Additionally, it is important to consider the nature of your data and the specific requirements of your project when deciding on the metrics to use.
Using Mean Absolute Percentage Error in model monitoring
MAPE is not only useful for evaluating model performance but also for continuous monitoring of a model after deployment.
- Setting Thresholds: You can set a threshold for MAPE, which, if crossed, triggers an alert. This helps in keeping an eye on the model’s performance and ensuring that it doesn’t degrade over time.
- Detecting Data Shifts: Significant changes in MAPE could be indicative of changes in the underlying data distribution. Keeping track of MAPE could help in detecting these shifts early on.
- Model Retraining: Regularly monitoring the MAPE can inform you when it might be time to retrain your model with new data to improve its accuracy.
Wrapping up Mean Absolute Percentage Error
Understanding Mean Absolute Percentage Error (MAPE) is crucial for anyone in predictive modeling, particularly for evaluating and monitoring forecasting models. However, it’s imperative to recognize its limitations, such as inaccuracy near zero values and asymmetry. Thus, incorporating complementary metrics like Mean Absolute Error (MAE) or Root Mean Squared Error (RMSE) is advisable for a more comprehensive evaluation.
Being vigilant regarding your data’s nature and the specific requirements of your forecasting tasks will empower you to make informed decisions about which metrics to employ. I hope this article has shed light on MAPE, and I encourage you to stay curious and continue learning. Happy monitoring!
