

April 4, 2024 - last updated
Machine Learning
Dealing with outliers in A/B testing: Methods and best practices
*Google collab with code snippets here.
**Notebook tests use simple dummy data, not to simulate real-life data, but to demonstrate the methods.
When making improvements to your website or mobile app, A/B testing is often really important to test major changes.
Sometimes the behavior you want to test only makes sense for a segment of users. For example, you might want to test some conversion offers to get users to spend money in your app for the first time, so this would only make sense to test it for users who have never spent.
Other times though you might want to test features for your most valuable users. If the apps are based on subscription models the spending is capped for the users. However, in other cases, the spending is not capped, so we could have a wide variety of spending habits across users.
A simple case of A/B testing
Let’s go back to our example test for new users.
Imagine a newspaper website that just changed its model so that most articles can only be viewed by becoming a premium user. You could implement some Limited Time Offers, that will show a timer indicating how much time is left to purchase that offer.

But how can you track the success of that offer campaign? One of the easiest ways would be to run an A/B test. You could randomly assign all of your users who have never purchased your subscription to two groups. Half of the users will belong to the control and the other half to the variant.
One easy way to do this is using SQL (assuming that the user IDs are generated randomly to avoid any bias and that we have a table called users):
Sample SQL code to compute the test groups – refer to Google Collab – CODE 1: Query to create AB test groups
SELECT
  user_id,
  CASE WHEN user_id % 2 = 0 THEN 'Control' ELSE 'Variant' END AS group_name
FROM users;
Next, you can show the users in the variant the limited-time offers over a few days, and then analyze the results.
Before starting the test it’s good to decide how long you want to run it and which metric you’ll be assessing. In this case, offer conversion seems to be a meaningful KPI to track.
Sample SQL code to compute the purchase conversion – refer to Google Collab – CODE 2: Compute the purchase conversion
SELECT
    group_name,
    COUNT(*) AS total_purchases,
    COUNT(*) / SUM(COUNT(*)) OVER () AS purchase_conversion
FROM
    purchases
GROUP BY
    group_name;
To determine if the increase in conversion is significant, frequentist or Bayesian methods can be used. However, in some cases, the lift could be clear just by looking at the relevant metrics per group. Also, some additional analyses might be required to understand why the test worked or in the case when results are not as expected, why the test failed.
If the test is successful, then the campaign can be considered a success and most likely you could plan to repeat it in the future.

A more complicated case of A/B testing
Ok, that was easy.
But what if you have a mobile app for playing poker and you want to make drastic changes to the user experience? This could have a big impact on our most loyal customers as they are already used to the current experience.
For this type of test, the assignment of the groups is the same, but instead of testing on new users you could decide to test it on all users or old users, but paying special attention in the analysis to the segment of old users that are very engaged in our app.
Then, you would select some relevant metrics:
- Retention: Has the user logged into the app at least once 7 days after the change was made?
- Monetization: How much money is the user spending after the change?
For this test, you might need to wait a couple weeks to observe meaningful behavior and impact in your app. Also, if any drastic negative changes are observed in any of the metrics on the variant during the first days of the test, you might want to consider turning the test off and analyzing the possible root cause. Hence, monitoring metrics is important.
Once you have users that have experienced this behavior for 2 weeks, you are ready to analyze the results.
Code examples with polars, similar to pandas, but amazingly fast! Especially handy when dealing with big datasets.
Refer to Google Collab – CODE 3: Compute retention, compute monetization (revenue)
You see that the variant is clearly better, but by looking closer at the different users you see some worrying signals: it seems that outliers are skewing the results. But, could it be possible that the new behavior is creating more big spenders?
Let’s find out!
Method 1: Remove outliers
The easiest thing to do is to define a threshold for the outliers (e.g. based on the 95 percentile or just a fixed threshold based on business logic). For example, assume that users who have spent more than $100 are big spenders. Then, you can easily filter those out and compare the results.
Refer to Google Collab – CODE 4: Compute retention, compute monetization (revenue)
def remove_outliers(df: pl.DataFrame, max_revenue: float) -> pl.DataFrame:
    """
    Remove outliers from a DataFrame based on the 'revenue' column.

    Parameters:
        df (pl.DataFrame): The input DataFrame.
        max_revenue (float): The maximum allowed value for the 'revenue' column.

    Returns:
        pl.DataFrame: A new DataFrame with outliers removed.
    """
    return df.filter(pl.col('revenue') < max_revenue)
Method 2: Clip the outliers
def clip_outliers(df: pl.DataFrame, max_revenue: float) -> pl.DataFrame:
    """
    Clip the outliers in the 'revenue' column of the DataFrame to a specified maximum revenue.

    Args:
        df (pl.DataFrame): The input DataFrame.
        max_revenue (float): The maximum revenue value to clip the outliers.

    Returns:
        pl.DataFrame: A new DataFrame with a new column named "revenue_clipped" that has the outliers in the 'revenue' column clipped to the specified max_revenue.
    """
    return df.with_columns(
        pl.col("revenue").clip(lower_bound=0, upper_bound=max_revenue).alias("revenue_clipped")
    )
Instead of removing the impact of your best users, you can decide to keep them, but limit their skew in our A/B test results by clipping high revenue values. The same rationale to decide this value can be used as with the previous method.
It is interesting to note that results might vary depending on the method selected and also what value you use for considering users as big spenders. In cases where the behavior introduced could have incentivized spending, it’s not advisable to remove spenders because some of those big purchases might have been caused by the behavior tested. In these cases, if you decide to clip the spending, selecting a high enough value is important to still capture that impact.
Method 3: Investigate outliers
You could decide to investigate the outliers in more detail. By doing a point-in-time analysis you could determine if there was a drastic change in spending after the feature was released. If so, you could decide to keep the high value. Otherwise, you could clip or remove the values with previous methods.
The main problem with this approach is that sometimes it might be hard to be sure if the change was caused due to the AB tests.
In some cases, the behavior being tested might not explain why users would spend more. In this scenario, maybe removing those users would be a good approach. However, even if you think some changes won’t affect some users, sometimes you might be wrong, meaning there’s always a risk involved in removing big spenders.
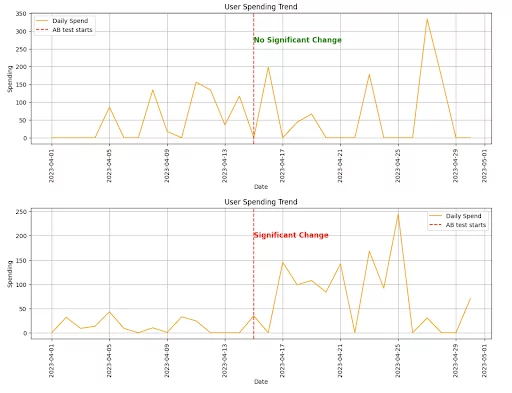
One way to determine if outliers are relevant is to perform statistical tests comparing the data before and after the test for the different users. The plots below are just for a single user, and performing this analysis for a huge number of users might be unfeasible. However, big spenders are usually rare as they are outliers, so in general, the number of users should not be that big, making it computationally sensible.
One naive approach to test this is to compute the mean spend of the user before the start of the test and after the start of the test. You can then ignore the point in time when the test happened and permute the dates to compute the same mean difference. Then we can compute the p-value to determine if the difference between the two is significant.
Instead of using permutations, other statistical tests might work, but careful selection is required depending on the distribution assumptions of the chosen statistical test.
Below you can see outputs from two different users. One where no significant change in spending pattern was observed after the test started, and another one where significant change was observed. You could decide to remove or clip the first one but keep the second as you attribute that increase in spend to the experiment treatment.
Refer to Google Collab – CODE 5: How to determine if an outlier is relevant or not. Run permutation test.
Wrapping up
Outliers are critical to assess in A/B tests and correctly dealing with them and understanding the root cause of why they appear is important. This analysis will vary a lot depending on the spending patterns of your users and what feature is being tested. Even if A/B tests are successful, you can still learn valuable lessons about how your users interact with your website or app, so analyzing the results closely is very important.
